Visualizing Biological Mechanisms
- Role
- Project lead. Designed and built the app, and mentored an undergraduate researcher on the project.
- Team
- Elizabeth Childs and Ryan Li (undergraduate researcher)
- Deployment
- Tested at 5 institutions with over 100 high school students
- Tools & techniques
- Unity, OpenCV, augmented reality, computer-vision volume tracking, and classroom deployment.
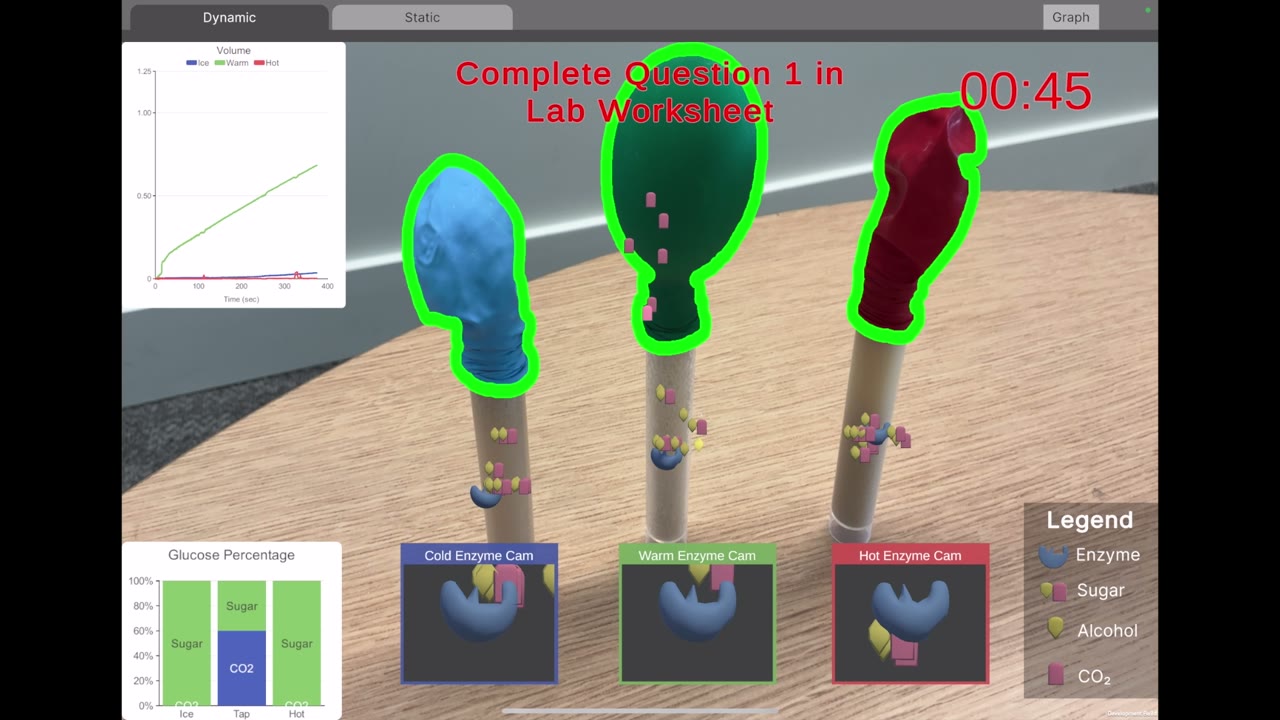
In a classic high school biology lab on yeast fermentation, students mix yeast and sugar in test tubes, cap each tube with a balloon, and watch the balloons inflate at different rates depending on the water temperature. The observation is easy to see. The mechanism behind it isn’t: enzymes break sugar down into alcohol and carbon dioxide, and the CO₂ is what fills the balloon. This app makes that hidden process visible while students run the real experiment, so they can connect what they observe to why it happens. It has been tested at 5 institutions with over 100 students.
How It Works
Students set up three test tubes of yeast and sugar solution, one each in cold, room-temperature, and hot water, and cap each with a balloon. They then point a tablet at their own experiment.
- Computer vision tracks the real balloons. Students tap each balloon to tell the app which tube is which, and the app then uses computer vision to track each balloon and estimate its volume as it inflates.
- Enzymes you can watch. Animated enzymes bind to sugar molecules, split them into alcohol and CO₂, and the CO₂ floats up the tube into the balloon above it.
- Temperature changes the reaction. Enzymes move and react at different speeds depending on the temperature of each solution, matching what students see in their three tubes.
- Synced to the students’ own data. The app converts each balloon’s measured volume into how many reactions the enzymes have catalyzed and animates exactly that much activity, so the visualization reflects the students’ own experiment, not a scripted one.
- Multiple views of the same process. A close-up “enzyme cam” for each tube, a live graph of balloon volume over time, and a bar showing how much of each tube’s sugar has turned into CO₂.
- Guided inquiry. Prompts walk students through the questions on their lab worksheet as the experiment unfolds.
Why Augment a Real Lab?
Simulations can show enzymes clearly, but they replace the experiment students are actually doing. Here the physical lab stays at the center. Students still mix the solutions, control the temperatures, and watch real balloons inflate, and the digital layer explains the mechanism behind what is happening in front of them.